Reduce Callbacks 30% With Better Closeouts
A callback is the most expensive type of work a service business performs. It carries the full cost of a regular job - labor, drive time, fuel, vehicle wear - with zero revenue attached. The technician who returns to fix a problem they should have caught the first time is not generating income. They are consuming it. And the damage goes beyond the direct cost of the return visit. The original schedule gets disrupted, the client's trust takes a hit, the tech feels demoralized, and if the callback happens during peak season, it steals a time slot that could have held a paying job.
Most service business owners know callbacks are a problem. What they underestimate is how much they cost and how preventable they are. A company running 200 jobs per month with an 8 percent callback rate is absorbing 16 return visits. At an average cost of $150 to $250 per callback in labor and fuel, that is $2,400 to $4,000 per month in pure loss. Cutting that rate to 4 percent saves half of that - $14,000 to $24,000 per year - from a problem that is almost entirely fixable with better habits at the end of every job. 📊
Why Techs Rush the Last 15 Minutes
The root cause of most callbacks is not incompetence. It is time pressure. Technicians who are running three to five calls per day feel the weight of the schedule. When a job takes longer than expected - and they often do - the tech starts thinking about the next appointment, the drive time, the client who is already waiting. The last 15 minutes of the job, when testing and verification should happen, get compressed or skipped entirely.
This is a management problem, not a technician problem. If your schedule is packed so tightly that there is no buffer for jobs that run long, you are building callback risk into every day. A tech who finishes a repair and should spend 10 minutes testing the system will skip that step if they know the next client has been waiting for 30 minutes. The rational choice in the moment - get to the next call - creates an irrational cost downstream when the untested repair fails.
The fix starts with scheduling. Build 15 to 20 minutes of buffer between appointments to account for variable job duration. Yes, this means one fewer appointment per day in the schedule template. But if that buffer prevents even one callback per week, you come out ahead on both revenue and client satisfaction. A tech who has breathing room at the end of a job will do better work because they are not making quality-versus-speed tradeoffs on every call.
The Six Root Causes of Callbacks
Callbacks cluster around a surprisingly small number of failure modes. Understanding the root causes tells you exactly where to focus your prevention efforts.
| Root Cause | Description | Prevention |
|---|---|---|
| Poor initial diagnosis | Treating symptoms instead of the underlying problem | Structured diagnostic checklist before starting any repair |
| Wrong or substandard parts | Off-spec substitutions that fail faster | Truck stocking standards and mandatory OEM-first policy |
| Inadequate testing | Checking that the system turned on rather than verifying sustained operation | Minimum test duration requirements per job type |
| Incomplete work scope | Missing adjacent components affected by the same failure | Full-area inspection protocol beyond the immediate repair zone |
| Environmental factors | Ignoring conditions around the repair that will cause re-failure | Contextual assessment step added to the diagnostic process |
| Communication failures | Client misinterprets normal post-repair behavior as a new problem | Two-minute closeout explanation at every job |
Poor initial diagnosis is the first major cause. A tech who treats the symptom instead of identifying the underlying problem will often fix the immediate complaint only to have a related failure surface within days or weeks. An AC system that is low on refrigerant might get topped off when the real issue is a slow leak at a flare fitting. The system works for a few weeks, then the client calls again with the same complaint. The tech now has to return, find the leak they should have looked for originally, and repair it - all on your dime.
Using wrong or substandard parts is the second cause. A tech who substitutes a part because the correct one is not on the truck is gambling with a callback. An off-spec capacitor might work initially but fail faster. A generic supply line might not handle the pressure as well as the OEM part. Every substitution introduces risk, and the cost of that risk is a return trip when the substitute fails.
Inadequate testing after repair is the third and most preventable cause. A furnace that fires up and produces heat for two minutes has not been verified. It needs to run through multiple cycles, and the tech needs to confirm that the flame sensor reads properly, the limit switch is not tripping, and the inducer motor sounds normal under sustained operation. Cutting the test short is the single most common shortcut that generates callbacks.
Incomplete work scope is the fourth cause. A tech replaces a leaking shutoff valve but does not check the adjacent connections that may have been stressed by the same corrosion or age. A week later, the fitting next to the new valve starts dripping. The client sees this as a callback on the original repair even though it is technically a different failure. Better initial inspection prevents this perception problem and the real cost of the return visit.
Environmental factors missed during diagnosis represent the fifth cause. A bathroom exhaust fan replacement that does not address the undersized ductwork will still have performance issues. An outdoor electrical panel repair that ignores water intrusion will fail again. Good technicians assess the environment around the repair, not just the component itself.
Communication failures are the sixth cause. Sometimes the repair is done correctly, but the tech did not explain to the client what was fixed, what was not included, or what to expect. A client who hears a new sound from their HVAC system after a repair might call back thinking something is wrong when the sound is actually normal operation that the previous failing component was masking. A two-minute explanation at closeout prevents a callback that costs $200.
Building a Closeout Checklist That Prevents Return Visits
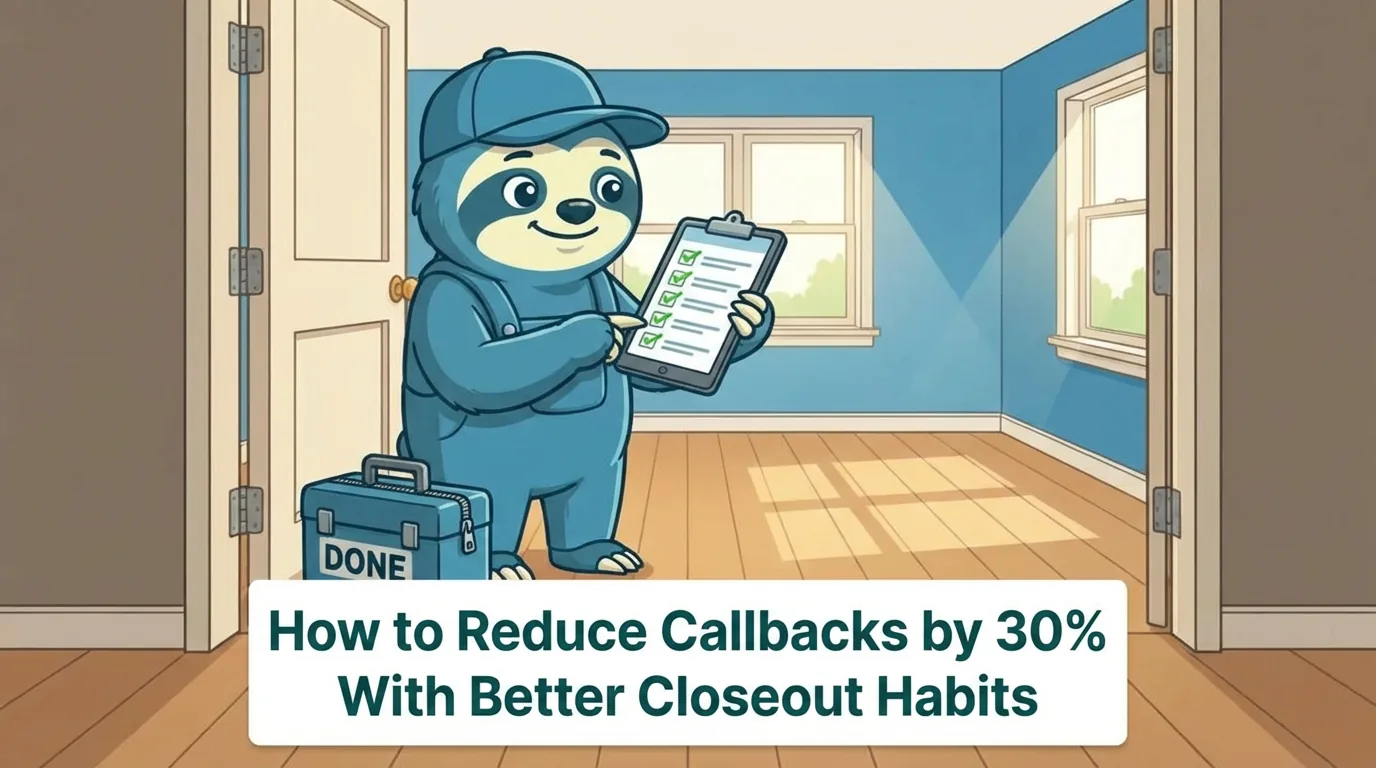
A closeout checklist is the single most effective tool for reducing callbacks. It forces the tech to verify their work before they leave the job site, while the system is still running and while they still have their tools out. The best closeout checklists are specific to the trade and the job type, not generic quality checklists that could apply to anything.
| Trade | Key Closeout Steps |
|---|---|
| HVAC | Run full cycle to set temp - check temp split across evaporator - verify condensate drain flow - tighten electrical connections and confirm amp draws - check refrigerant pressures if opened - inspect air filter |
| Plumbing | Run water under pressure for 5 minutes - check all connections with dry paper towel - verify drain flow rate and slope - confirm shutoff valves operate fully - camera check on drain work if scoped |
| Electrical | Test all circuits under load - verify GFCI and AFCI trip and reset - check wire torque on connections - confirm panel labeling - test dimmer and switch full range |
For HVAC repair closeout, the checklist should include: run the system for a full cycle and verify it reaches set temperature, check the temperature split across the evaporator coil, verify the condensate drain is flowing, tighten all electrical connections and confirm amp draws are within spec, check refrigerant pressures if the system was opened, and inspect the air filter condition. Each of these items addresses a specific callback risk. Skipping any one of them is gambling.
For plumbing closeout, the checklist should include: run water through the repaired section for a full five minutes under pressure, check all connections for drips with a dry paper towel or tissue (visual inspection misses slow seeps), verify drain flow rate and check for proper slope, confirm shutoff valves operate fully, and run a camera check on drain work if scope warrants it. The paper towel test for leak detection catches failures that a quick glance will miss, and it takes 30 seconds.
For electrical closeout, the checklist should include: test all circuits under load (not just continuity), verify GFCI and AFCI outlets trip and reset correctly, check wire connections for proper torque, confirm panel labeling matches actual circuits, and test dimmer and switch operation through their full range. Electrical callbacks are not just expensive - they carry liability risk. A loose connection that arcs can cause a fire. The closeout checklist is as much about safety as it is about margin protection. 🛠️
Photo Documentation as a Callback Shield
Photographs taken at closeout serve two purposes. They prove the work was done correctly at the time of completion, and they force the tech to visually inspect their own work through the camera lens. That second function is underrated. A tech who photographs the completed repair from three angles will often notice something they would have missed during a casual glance - a fitting that is slightly off-angle, a wire that is not fully seated, a drip that is just starting to form.
The standard should be three to five photos per job: the completed repair from a wide angle showing context, a close-up of the key connection or component, the area around the repair showing it was left clean, the system running or the meter reading confirming normal operation, and any pre-existing conditions that were noted but not part of the scope. That last photo is critical for preventing disputed callbacks. If the tech photographs a corroded fitting adjacent to their repair and notes it in the job record, the company has documentation when that fitting fails a month later and the client calls expecting a free return visit. 📷
Store photos in the job record within your field service management system so they are immediately accessible if a callback is requested. When a client calls about a problem, the office can pull up the closeout photos and often determine whether the issue is related to the original repair before dispatching a tech. This pre-screening alone can prevent unnecessary truck rolls and redirect the conversation to a new service call when appropriate.
Testing Protocols That Catch Problems Before You Leave
The difference between a test and a verification is time. A quick check confirms the system turned on. A proper test confirms the system operates correctly under realistic conditions over a meaningful duration. Most callbacks happen because the tech performed a check when they should have performed a test.
For HVAC systems, run the unit for at least 15 minutes after repair and observe it through one or two complete cycles. A furnace that fires and heats for three minutes has not been tested - it has been turned on. The flame sensor might read correctly for five minutes and then start drifting. The blower motor might develop a bearing noise under sustained load that was not present during a cold start. Fifteen minutes catches these issues. Three minutes does not.
For plumbing, let water flow through the repair under full pressure for five minutes minimum. Slow leaks at threaded connections and compression fittings often do not appear for two to three minutes as the fitting seats under pressure. A tech who runs water for 30 seconds, sees no drip, and packs up is rolling the dice. Five minutes under pressure with a dry paper towel wiped across every connection catches nearly every leak that would otherwise become a callback.
For electrical work, test under actual load conditions. A circuit that checks fine with a meter might behave differently when the 1,500-watt space heater and the microwave are both running. If you replaced a breaker or rewired a circuit, turn on the loads that circuit actually serves and let them run while you verify the breaker holds and the connections stay cool. An infrared thermometer on wire connections under load will reveal loose connections that feel fine to the touch but are building heat that will eventually cause a failure.
Tracking Callback Rates Per Technician
You cannot improve what you do not measure, and callback tracking per technician is one of the most revealing metrics in a service business. It separates assumption from reality. The tech you think is your best performer might actually have the highest callback rate because they rush through jobs. The slower, more methodical tech might have the lowest callback rate and the highest overall profitability per job when you account for the return visits they prevent.
Track callbacks as a percentage of completed jobs per technician per month. A tech who completes 80 jobs with 3 callbacks has a 3.75 percent rate. A tech who completes 100 jobs with 8 callbacks has an 8 percent rate. The second tech looks more productive by volume but is actually costing the company more when you factor in the rework. Share these numbers with your team - not punitively, but as performance data that drives improvement. 📈
When a tech has a high callback rate, dig into the reasons. Are they consistently rushing? Do they lack training on a specific type of repair? Are they substituting parts because their truck is poorly stocked? The callback data tells you there is a problem, but the root cause analysis tells you how to fix it. Often the solution is targeted training on a specific procedure, better truck stocking, or schedule adjustments that give the tech more time per job.
How Callbacks Destroy Schedule Density and Margins
Schedule density - the number of revenue-generating jobs completed per truck per day - is the most important operational metric in a service business. Every callback directly reduces schedule density because it occupies a time slot that could have held a paying job. But the damage goes beyond the single slot.
A callback typically disrupts the schedule in unpredictable ways. The client with the problem wants it fixed soon, often same-day. That means pulling a tech off their planned route to handle the return visit, which pushes their remaining appointments later. Depending on timing, one or two of those appointments may need to be rescheduled to another day, which means the client waits longer and your schedule for that future day gets packed tighter - increasing the pressure that causes more callbacks.
The margin impact is equally compounding. A job that generates a callback effectively costs twice the labor but only bills once. If your gross margin on a $400 job was 55 percent, the $220 gross profit gets consumed by the $150 to $250 callback cost. The job is now breakeven or negative. Across a month, callbacks with this margin impact on even 5 percent of your jobs can reduce overall profitability by 10 to 15 percent. The businesses that take callbacks seriously protect their margins at the source rather than trying to make up for the loss with volume.
Building Accountability Without Creating a Blame Culture
The goal of callback tracking and closeout standards is improvement, not punishment. Techs who feel they will be disciplined for every callback will start hiding them - handling return visits off the books, blaming the client, or discouraging clients from calling back by implying the issue is not their responsibility. None of these behaviors serve your business.
Frame callback reduction as a team goal with shared benefits. When the callback rate drops, schedule density improves, which means less overtime, less rushing, and more predictable days. Techs benefit directly from the improvement. Celebrate low callback rates publicly. Address high rates privately and constructively, focusing on what support the tech needs rather than what they did wrong.
Consider tying a small incentive to callback performance. A tech who maintains a callback rate below 3 percent for a quarter earns a bonus, extra PTO, or first choice on the schedule. This makes quality a competitive advantage for the technician, not just a mandate from management. Combined with proper closeout checklists, adequate testing time built into the schedule, and well-stocked trucks, accountability systems turn callback reduction from a frustrating management exercise into a self-reinforcing habit that improves every metric in the business. ✅
Frequently Asked Questions
Ready to transform your field service business?
Start using WorkZen today. It's free to get started!