Improve Technician Utilization, No Overbooking
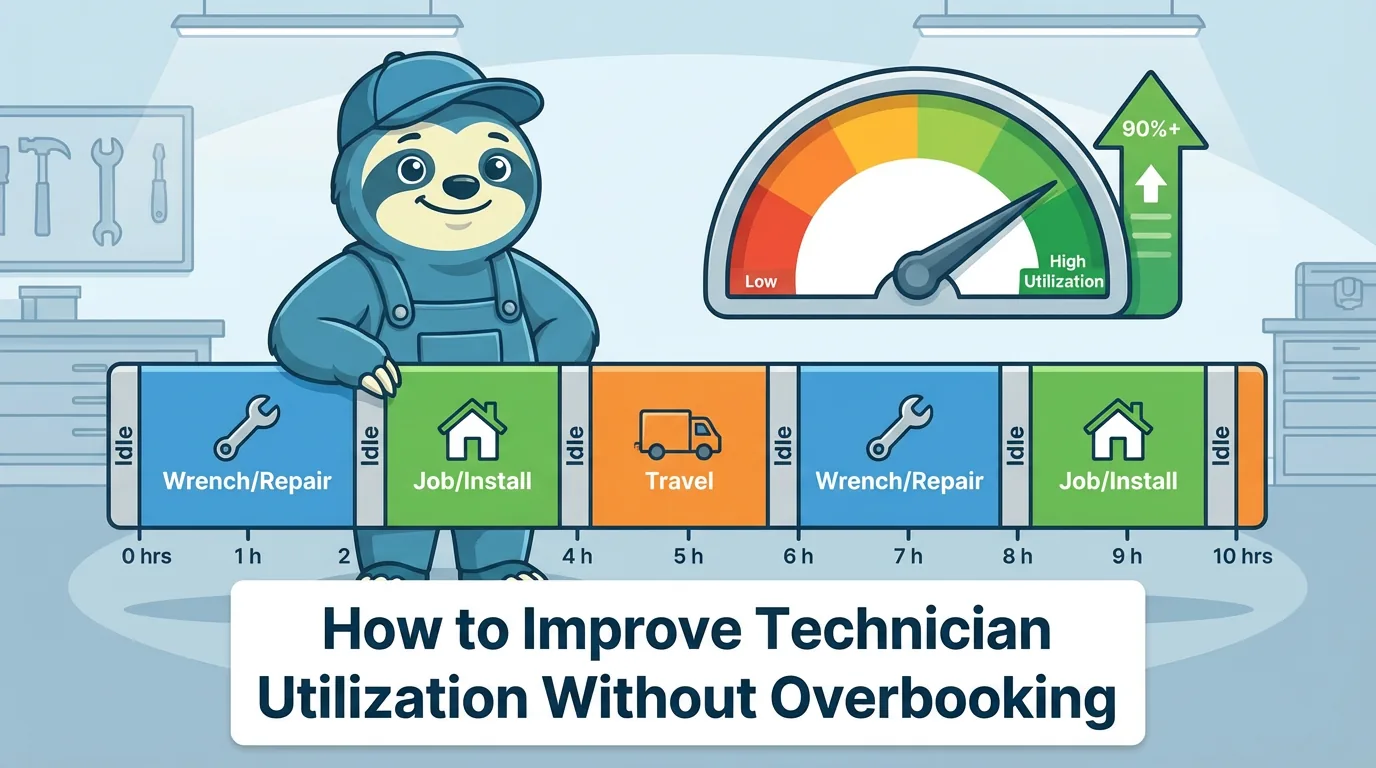
Every service business owner eventually stares at the same math problem. You are paying technicians for 40 hours a week, but only billing clients for a fraction of those hours. The gap between what you pay and what you bill is where profit either grows or dies. Technician utilization - the ratio of billable hours to available hours - is one of the most powerful financial levers in field service, and most companies leave enormous money on the table by never measuring it properly.
The challenge is that improving utilization is not as simple as cramming more jobs into the schedule. Overloading techs leads to sloppy work, callbacks, and turnover. The real opportunity is in eliminating waste - the dead time between jobs, the unnecessary return trips, the mornings spent hunting for parts that should have been on the truck. That is where utilization improvements actually live, and they compound in ways that transform the economics of a service operation.
What Technician Utilization Actually Means
Utilization rate is straightforward on paper: divide billable hours by available hours and multiply by 100. If a tech works an 8-hour day and spends 5.5 hours on billable client work, their utilization is about 69%. The remaining 2.5 hours went to driving, paperwork, parts pickups, breaks, and the other non-billable activities that keep a service operation running.
The distinction between billable and available hours matters more than most owners realize. Available hours should not include PTO, training days, or company meetings - those are not hours the tech could have been billing. Some owners inflate their utilization numbers by using calendar hours as the denominator, which makes the metric useless for decision-making. Honest measurement is the starting point for honest improvement.
Where it gets interesting is in the gray areas. Is drive time between jobs billable? In most residential service businesses, no. Is time spent writing up a detailed diagnosis for the client billable? It should be, but many companies lose that time because techs do it off the clock. Defining clear categories for how time gets classified is the foundation that everything else builds on. 📊
Healthy Benchmarks by Trade
Different trades have different utilization ceilings based on the nature of the work. A plumber running emergency calls across a wide service area will naturally have lower utilization than an HVAC maintenance crew running a tight geographic route of scheduled tune-ups. Understanding your trade's realistic range prevents you from chasing targets that do not make sense for your operation.
| Trade | Typical Utilization Range | Key Driver |
|---|---|---|
| Residential HVAC (mixed reactive + maintenance) | 60-70% | Unpredictable reactive call durations |
| Plumbing (maintenance contract base) | 70-75% | Predictable drain/maintenance jobs |
| Electrical contractors | 62-72% | Setup and teardown time per visit |
| Landscaping crews | 65-75% | Geographic routing efficiency |
| Cleaning companies | 68-78% | Fixed-duration, high-repeatability jobs |
The point is not to hit a universal number. The point is to know where you are today, understand what is realistic for your trade, and close the gap between your current rate and your achievable rate without breaking people in the process.
Why 100% Utilization Is a Myth
The fantasy of every tech billing every available minute is exactly that - a fantasy. It ignores the physical reality of field service work. Techs need to drive between jobs. They need to eat lunch. They need to restock their trucks, attend safety meetings, and occasionally deal with a job that runs long through no fault of their own. Scheduling at 100% means the first delay of the day creates a cascade of late arrivals and overtime.
Beyond logistics, there is the human cost. Technicians who feel like every minute is monitored and every gap is a failure become disengaged. They cut corners to stay on schedule, which creates callbacks. They skip documentation, which creates billing disputes. They burn out and quit, which creates recruiting and training costs that dwarf whatever revenue you gained from squeezing their schedule.
The best-run service companies aim for 65-75% utilization and treat the remaining time as strategic capacity. That buffer absorbs emergencies, allows for proper documentation, and gives techs breathing room to do quality work. Paradoxically, companies that target 70% utilization often generate more revenue per tech than companies targeting 85% because the quality of each billable hour is dramatically higher. ✅
The Five Levers That Actually Move Utilization
The biggest utilization killer in most service operations is windshield time - the hours techs spend driving between jobs. Route optimization, whether through software or simply smarter geographic scheduling, can recover 30-60 minutes per tech per day. That translates directly into one more billable job or a longer, more thorough job at an existing site.
Reducing callbacks is the second major lever. Every callback is a double hit - you lose the billable time for the return trip and you often cannot charge the client for fixing your own mistake. Investing in better first-visit diagnosis, carrying more common parts, and giving techs time to do the job right the first time pays for itself several times over.
The remaining levers work together as a system:
- Pre-staging parts and materials so techs start each day ready to work instead of making supply house runs
- Smarter scheduling that accounts for job complexity, travel time, and tech skill level rather than just cramming in maximum appointments
- Reducing administrative burden by giving techs mobile tools for invoicing, photos, and job notes so paperwork happens in real time instead of eating into the next morning
| Lever | Estimated Daily Gain per Tech | Difficulty to Implement |
|---|---|---|
| Route optimization | 30-60 min | Low - software handles it |
| Callback reduction (better first-visit diagnosis) | 20-45 min | Medium - training + parts stocking |
| Parts pre-staging | 15-30 min | Low - morning prep process |
| Smarter scheduling by complexity | 15-25 min | Medium - dispatcher discipline |
| Mobile tools for real-time admin | 10-20 min | Low - app adoption |
Each of these individually might add 15-30 minutes of billable time per tech per day. Combined, they can shift utilization by 8-12 percentage points, which for a five-person crew represents a massive revenue increase on the same payroll. ⚡
Measuring Utilization Accurately
You cannot improve what you do not measure, and most service businesses measure utilization poorly or not at all. The minimum viable approach is tracking clock-in and clock-out times alongside job start and job completion times. The difference between total work hours and total on-job hours is your non-billable time, and knowing that number is the first step.
The next level is categorizing non-billable time. How much is travel? How much is parts runs? How much is administrative work? How much is genuinely idle time where a tech is available but has no job assigned? Each category has a different solution, and lumping them all together as "overhead" prevents you from finding the specific bottleneck in your operation.
Weekly utilization reviews with your dispatch team create accountability and surface patterns. You might discover that Tuesdays consistently have lower utilization because your scheduling process front-loads Monday and leaves gaps mid-week. Or that one tech's utilization is 15 points below the team average because they are assigned jobs across a wider geography. These patterns are invisible without consistent measurement and regular review. 🎯
Using Buffer Time Intelligently
Buffer time is not wasted time - it is strategic capacity. The difference between a well-run operation and a chaotic one often comes down to how intentionally buffer time is designed into the schedule. Fifteen minutes between jobs absorbs the inevitable overruns and prevents the domino effect of one late job pushing every subsequent appointment.
Smart operators use buffer time productively when things go according to plan. A tech who finishes 20 minutes early can use that time for truck inventory, job documentation, or even a quick follow-up call to a previous client. These activities are not billable, but they reduce future non-billable time by preventing parts shortages and callbacks.
The key is building buffer into the schedule by design rather than hoping it appears by accident. Some companies block 10-15% of each tech's day as buffer and treat it as committed time. If a day runs perfectly, that buffer becomes available for add-on work or proactive maintenance visits. If the day has hiccups, the buffer absorbs them without overtime or missed appointments.
The Connection Between Utilization and Revenue Per Tech
Revenue per technician is the ultimate measure of whether your utilization improvements are working. A tech billing at 70% utilization on 40 available hours generates 28 billable hours per week. At a blended rate of 90 dollars per hour, that is 2,520 dollars in weekly revenue per tech. Pushing utilization to 75% on the same hours adds 450 dollars per week - over 23,000 dollars per year per tech - with no additional payroll cost.
| Utilization Rate | Billable Hours/Week | Weekly Revenue (at $90/hr) | Annual Revenue per Tech |
|---|---|---|---|
| 60% | 24 hrs | $2,160 | $112,320 |
| 65% | 26 hrs | $2,340 | $121,680 |
| 70% | 28 hrs | $2,520 | $131,040 |
| 75% | 30 hrs | $2,700 | $140,400 |
| 80% | 32 hrs | $2,880 | $149,760 |
The math scales powerfully with team size. For a ten-person crew, a five-point utilization improvement at 90 dollars per hour represents roughly 234,000 dollars in annual revenue. That is new revenue generated entirely from better operations, not from adding trucks or running more ads. It is why utilization is often called the most profitable metric in field service.
But revenue per tech only tells the full story when paired with quality metrics. If utilization goes up but callback rates also climb, you are just shifting costs from idle time to rework. Track utilization alongside first-time fix rate, client satisfaction scores, and technician retention. When all four metrics move in the right direction together, you know you are building something sustainable rather than just squeezing harder. 📈
Building a Utilization Improvement Plan
Start with a two-week baseline measurement before changing anything. Track every tech's billable and non-billable hours, categorize the non-billable time, and calculate your current average utilization. This baseline is your honest starting point, and it is often 5-10 points lower than what owners estimate because gut feel tends to be optimistic.
Pick the single largest category of non-billable time from your baseline data and focus your first improvement effort there. If travel time is the biggest bucket, invest in route optimization. If parts runs are eating mornings, build a pre-staging process. If callbacks are high, implement a first-visit checklist. Trying to fix everything at once dilutes attention and makes it impossible to know what actually worked.
Set a 90-day target that is ambitious but not absurd - a 3-5 point utilization improvement is a strong first goal. Review progress weekly with your dispatch and field leadership. Celebrate the wins publicly because techs who understand how utilization connects to company health and their own job security become allies in the improvement process rather than skeptics. After the first 90 days, reassess, pick the next biggest lever, and repeat.
Avoiding the Burnout Trap
Every conversation about utilization needs a burnout check. The warning signs are predictable: rising overtime, increasing sick days, more callbacks, declining client satisfaction scores, and techs who stop volunteering for extra shifts. These signals appear weeks before someone actually quits, and by that point the damage is done - you lose the tech, their institutional knowledge, and the months of productivity it takes to recruit and train a replacement.
The antidote to burnout is not lower expectations but better systems. Techs burn out when they feel like they are working hard but spinning their wheels - fighting traffic, hunting for parts, redoing sloppy work from the previous visit. When utilization improves because systems eliminate waste rather than because the schedule got tighter, techs actually feel better about their work because more of their day is spent doing the skilled trade they trained for.
Build feedback loops that give technicians a voice in the process. They know better than anyone where time gets wasted and which scheduling patterns create stress. A tech who helped design the new routing system will champion it. A tech who had it imposed on them will resist it. The difference between a utilization program that sticks and one that dies after a quarter is almost always about how much input the field team had in building it.
Frequently Asked Questions
Ready to transform your field service business?
Start using WorkZen today. It's free to get started!